Special topics
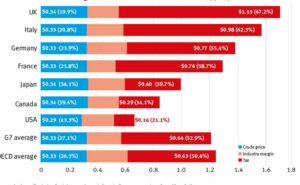
 The graph above illustrates the inter-country variations in the average price of one litre of oil across G7 countries as well as the OECD average during 2015. It is important to note that these price variations are mainly due to the widely varying levels of taxes (highlighted in red) imposed by major oil consuming nations. These can range from relatively modest levels – like in the USA – to very high levels in Europe and Asia/Pacific.
For example, in the UK the government in 2015 earned about 67.2% of the price charged for every litre of pump fuel sold to consumers. On the other hand, oil producing countries (including OPEC) earned about 19.9% of the total pump fuel price.
Source: http://www.opec.org/opec_web/en/data_graphs/333.htm